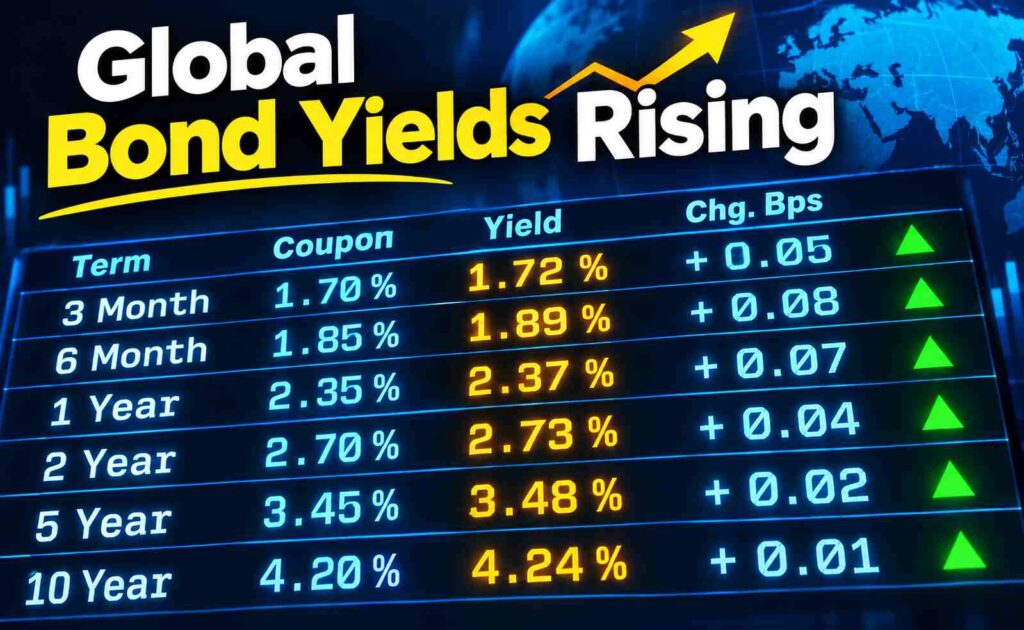
Bond yields are rising across most big economies in 2026 because investors want more compensation for lending money to governments. Three forces do most of the work. The first is an energy shock tied to the war with Iran, which has kept inflation above target. The second is central banks that have switched from cutting rates to raising them. The third is heavy government borrowing that markets have to absorb.
On 24 September 2026, the US 30-year Treasury yield touched 5.501%, a level not seen since June 2004, and the 10-year reached 5.223%, its highest since June 2007. The same day, Japan’s 10-year yield rose to 3.055%, the highest since August 1996.
One detail gets lost in most coverage. In the US, the market’s own measure of expected inflation has barely moved since spring. Most of the rise has come from higher real yields and from traders betting on more Fed hikes. That distinction changes how to read what comes next.
What a bond yield actually measures
A bond yield is the annual return an investor earns on a bond at its current market price. A government borrows $1,000, promises fixed interest payments (the coupon), and repays the $1,000 at maturity. The coupon never changes. The price investors pay for the bond in the market does, and the yield changes with it.
| Term | Plain meaning | Why it matters now |
|---|---|---|
| Face value | The amount repaid at maturity | Fixed, so price moves change the yield |
| Coupon | The fixed interest the bond pays | Older low-coupon bonds lose value when new bonds pay more |
| Yield to maturity | Total annual return if held to the end, at today’s price | This is the number headlines quote |
| Basis point | 0.01 percentage point | A 10 bp move is 0.10% |
| Duration | How sensitive a bond’s price is to yield changes | Long bonds fall hardest in a selloff |
| Real yield | Yield after expected inflation | Rising sharply in 2026 |
| Term premium | Extra return demanded for locking money up longer | Debated; model estimates differ |
Why bond prices fall when yields rise
Take a 10-year government bond with a $1,000 face value and a 4% coupon, so it pays $40 a year. When it was issued, 4% matched what the market wanted.
Now suppose new 10-year bonds pay 5%. Nobody will pay $1,000 for a bond paying $40 when a new one pays $50. The old bond’s price has to drop until its total return matches 5%. Discounting its ten $40 payments and the final $1,000 at 5% gives a price of about $923, a fall of roughly 7.7%. (This is a simplified calculation assuming annual coupons.)
That’s the whole mechanism. Yields don’t rise and then drag prices down; sellers push prices down, and the yield is simply the return a buyer gets at the new, lower price.
Duration tells you the size of the hit. That bond has a duration of roughly 8, so a 1-point rise in yields cuts its price by about 8%. A 30-year bond can have a duration near 17, which is why long-dated bonds have taken the heaviest losses in 2026.
What is pushing bond yields up in 2026
| Driver | How it lifts yields | Most visible in |
|---|---|---|
| Energy prices | Raise inflation and push central banks toward hikes | Eurozone, UK, Japan |
| Central bank hikes | Lift short-term yields directly | US, eurozone, Japan |
| Strong growth | Raises the expected path of rates | US, eurozone |
| Government borrowing | More bonds to sell, so buyers demand a higher return | UK, Germany, Japan, US |
| Term premium and QT | Less central bank buying, more risk to hold long bonds | UK, US (debated) |
Energy and inflation
Markets have been under pressure for months as the U.S.-Israeli war on Iran has pushed up energy prices. In the US, consumer prices rose 3.4% over the 12 months to August, and gasoline accounted for over a third of August’s monthly increase. Core inflation (excluding food and energy) was calmer, at 2.4% year on year. That gap matters: the shock is concentrated in energy, which is part of why long-run inflation expectations haven’t jumped.
Central banks switched from cutting to hiking
This is the biggest change from a year ago. The Fed cut three times in late 2025 to a range of 3.50%–3.75% before raising rates again in September 2026. The vote was unanimous, and the median official expects one more 25 basis point hike in 2026.
The ECB moved first. It raised all three key rates by 25 basis points on 10 September, taking the deposit rate to 2.50%, its second hike of the year. The Bank of Japan raised to 1.25% in a 7-2 vote, the highest since April 1995. When markets expect higher policy rates for years ahead, every yield linked to those expectations reprices upward.
Growth has been stronger than feared
The 23 September selloff wasn’t triggered by an inflation print. S&P Global data showed robust US business activity in September alongside hot inflation from energy, and traders raised the odds of an October Fed hike to 69%, up from 11% a month earlier. Reuters noted that nominal US growth ran at around 8% in the second quarter. In Europe, eurozone private-sector activity expanded in September at its fastest pace in almost three and a half years.
Strong growth lifts bond yields because it gives central banks room to keep rates high. Weak growth tends to do the opposite, which is why yields often fall in recessions even when governments borrow more.
Governments are borrowing record amounts
Germany’s finance agency said it expects federal borrowing to hit a record €525.5 billion in 2026 and to rise further next year. In the UK, the budget deficit widened to £18.3 billion in August, above economists’ expectations of £15.5 billion. Japan’s position is the most stretched: government debt exceeds 200% of GDP, and debt service is estimated at more than 25% of government expenses for fiscal year 2026.
More bonds on offer doesn’t mechanically raise yields. If savers and foreign buyers want them, supply gets absorbed. The problem in 2026 is that supply is rising just as central banks, once the largest buyers, are stepping back.
Term premium and quantitative tightening
The term premium is the extra return investors demand for tying money up for 10 or 30 years instead of rolling over short-term loans. It rises when the future looks less predictable: uncertain inflation, uncertain budgets, heavy issuance. Vanguard’s Roger Hallam argues that a rising term premium, driven partly by high government bond issuance, has contributed to this year’s rise, and that deficits are high or rising across G7 nations including the UK, Japan, Germany and France.
Central bank balance sheets play into this. The Bank of England estimates its bond sales (quantitative tightening) have pushed gilt yields up by around a quarter of a percentage point, though some analysts put the impact nearer three-quarters of a point for 30-year gilts.
Term premium can’t be observed directly; it’s a model estimate. The New York Fed’s widely used ACM model put the US 10-year term premium at 0.61% on 17 September, down from 0.836% in July. That’s clearly positive (the same series hit a record low of -1.361% in July 2020), but by this model it hasn’t driven the latest leg higher. The ACM and Kim-Wright models do not always agree, so treat any single “term premium explains it” claim with caution.
A seven-question test for any yield move
Headlines treat every rise in yields as one story. Separating the drivers takes seven questions, each answerable with free data. The right-hand column applies them to the US in September 2026.
| Question | What to check | US reading, September 2026 |
|---|---|---|
| 1. Are policy expectations changing? | 2-year yield, CME FedWatch | Yes. The 2-year was 3.85% on 7 April; it reached 4.941% on 24 September |
| 2. Are inflation expectations rising? | 10-year breakeven (FRED: T10YIE) | No. 2.27% on 24 September, roughly 2.37% in April |
| 3. Are real bond yields rising? | 10-year TIPS yield (FRED: DFII10) | Yes. 1.96% in April to 2.81% on 24 September |
| 4. Is the term premium rising? | NY Fed ACM estimate | Positive but lower than in July, per ACM |
| 5. Is supply straining demand? | Auction results, issuance plans | Some strain: UOB cited weak demand at a $70 billion 5-year auction |
| 6. Is fiscal or political risk being priced? | Country spreads, long-end moves | 30-year at highest since 2004 |
| 7. Is growth changing the outlook? | PMIs, GDP | Yes, stronger than expected |
Read together, the US answer looks like this: the rise since spring has been driven mainly by expectations of higher Fed rates and higher real yields, both linked to strong growth, rather than by fear of runaway inflation. This is an interpretation of the data, not a certainty. The April and September figures come from different data providers and the breakeven for April is derived by subtraction, so treat the changes as approximate.
The test gives different answers in other countries, which is the point of using it.
Four markets, four different stories
| Market | Benchmark | Recent level | Main driver |
|---|---|---|---|
| United States | 10-year Treasury | 5.223% intraday, 24 Sep | Fed hikes, strong growth, real yields |
| United Kingdom | 10-year gilt | about 5.20–5.23% in late Sep | Sticky inflation, deficits, QT |
| Germany | 10-year Bund | 3.57% on 23 Sep | ECB hikes, record borrowing |
| Japan | 10-year JGB | 3.055% on 24 Sep | BOJ normalisation, weak yen |
United States. Treasuries are the global reference point, so their moves spill over. Reuters describes the split well: shorter-dated yields track expectations for interest rates, while the 30-year reflects investors’ willingness to finance government borrowing in the years ahead. One Columbia Threadneedle portfolio manager said the logic plainly: locking up money for 30 years now requires much higher compensation.
United Kingdom. The UK combines the highest inflation of the four with a large deficit. Earlier this month, the 30-year gilt yield reached 5.8856%, its highest level since March 1998. The Bank of England held rates at 3.75%, but three of nine members voted for a hike. It also paused gilt sales for six months and halted sales of long-dated gilts entirely, a move aimed partly at the long end.
Germany and the eurozone. Germany is borrowing heavily for defence and infrastructure, and the ECB is hiking into an energy shock. The ECB kept its 2026 inflation forecast at 3.0% and raised its 2027 projection to 2.5%. Bunds still trade well below US and UK yields because Germany’s debt load is lower. The direction, though, has been the same.
Japan. Japan’s story is about leaving decades of near-zero rates. The BOJ’s hikes, a weak yen and rising import costs have lifted yields across the curve, and the 5-year yield hit a record 2.345%. Japan matters globally because its investors are among the largest foreign holders of other countries’ bonds. When domestic yields become attractive, some of that money has less reason to go abroad.
China is the exception. Sovereign yields in China have drifted lower this year, reflecting weaker domestic inflation and growth. That contrast is a useful reminder that “global” yields respond to local conditions.
U.S. Treasury Yields: Why Are They So Important?
The U.S. Treasury market has an outsized influence on global financial markets.
The main maturities commonly discussed are:
| Treasury maturity | What it generally tells investors |
|---|---|
| 2-year | Expectations for near-term monetary policy |
| 10-year | Medium- to long-term growth, inflation and rate expectations |
| 30-year | Longer-term inflation, fiscal and term-premium considerations |
These are not rigid rules. Each maturity incorporates several factors.
The Federal Reserve’s yield-curve framework describes the yield curve as the relationship between the maturity of debt securities and their yields. The curve is closely watched for information about monetary policy and the broader economic outlook.
Because Treasury securities are widely used as reference rates, changes in Treasury yields can affect mortgage rates, corporate borrowing costs and other financial assets.
Nominal vs real yields
The nominal yield is the headline number. The real yield is what’s left after expected inflation. A simplified illustration: if a bond yields 5% and inflation is expected to average 2.5%, the approximate real yield is 2.5%. This ignores taxes, compounding and the fact that actual inflation will differ from expectations.
Markets provide a live version through inflation-protected bonds (TIPS in the US). On 24 September, the 10-year TIPS yielded 2.81% with a breakeven inflation rate of 2.27%. In mid-September, a 10-year TIPS auction produced a real yield of 2.653%, the highest in nearly 18 years. High real yields mean borrowing is genuinely expensive, not just expensive on paper because of inflation.
What the yield curve is saying
The yield curve plots yields from short to long maturities. A normal curve slopes upward. An inverted curve (short yields above long) has often, though not always, come before recessions. Steepening means the gap between long and short yields widens; flattening means it narrows.
Since April, US yields have risen in a bear flattening: all yields up, short ones faster. The 2-year to 10-year gap went from about 0.48 percentage points on 7 April to about 0.28 on 24 September, based on the figures in the table above. That pattern usually signals a policy-driven move.
The 30-year is the outlier. It reached its highest level since 2004 even as short-term yields led, suggesting investors are also demanding more to lend for decades. No curve shape guarantees a recession or a boom; it shows what markets expect today, and those expectations change.
Who feels higher yields
Governments pay more as old debt is refinanced at new rates. The effect builds over years, which is why Japan, with debt above 200% of GDP, is the most exposed.
Households feel it through mortgages and loans. Around the Fed’s September meeting, CNBC cited Mortgage News Daily data showing the 30-year fixed mortgage rate had climbed to 7.19%, up more than a full percentage point from a year earlier. US mortgage rates track the 10-year Treasury loosely, not one-for-one. Other countries’ mortgages link more to central bank rates or shorter-term swap rates.
Businesses face higher refinancing costs. According to Keeley Teton Advisors’ Thomas Browne, small-cap companies tend to hold more floating-rate debt than larger peers, so their interest costs can rise quickly.
Stocks don’t fall automatically when yields rise. BCA Research analysts noted that when inflation is the market’s focus, stocks and yields tend to move in opposite directions, while growth-driven rises often coincide with rising stocks; equities can absorb higher yields but struggle with rapid spikes. On 24 September, the S&P 500 slipped just 0.02% to 7,704.13 despite the jump in yields.
Existing bondholders take the price losses shown in the $1,000 example, largest for long-duration bonds. Holders who keep a bond to maturity still get the face value back (barring default). Their real cost is the higher yield they missed.
Who benefits: new buyers of bonds, savers in cash and short-term instruments, and income-focused investors can now lock in yields unavailable for most of the past 15 years. The risks don’t disappear. Longer bonds carry more price risk, corporate bonds add credit risk, short-term holdings face reinvestment risk if rates later fall, and inflation can still erode fixed payments.
How Do Rising Yields Affect Existing Bond Investors?
Existing bondholders face an important risk when market yields rise.
Suppose an investor owns a bond paying a fixed coupon. If newly issued bonds begin offering higher yields, the older bond may become less attractive.
Its market price can therefore fall.
This is known as interest-rate risk.
Duration matters
Longer-duration bonds are generally more sensitive to changes in interest rates than shorter-duration bonds.
That means a small change in yields can produce a much larger price movement in a long-maturity bond than in a short-maturity bond.
Other risks include:
- Credit risk
- Inflation risk
- Reinvestment risk
- Liquidity risk
An investor who holds a high-quality bond until maturity may experience a different outcome from someone who needs to sell that bond before maturity.
Are rising bond yields good or bad?
It depends on why they’re rising and how fast. Bond Yields rising because the economy is strong can be healthy: Vanguard’s economists note that a growth-driven rise could be benign or even supportive for stock valuations. Yields rising because investors doubt a government’s finances, or rising very quickly, carry more risk. A 15 basis point daily jump like the 10-year’s roughly 0.15 point gain on 23 September, its biggest since April 2025, tests markets more than a slow drift. The seven-question test above is the practical way to tell which situation you’re in.
Dates to watch
- 30 September: US PCE inflation data for August.
- 14 October: US CPI for September.
- 27–28 October: the next scheduled FOMC meeting.
- 29 October: the next ECB decision.
- 29–30 October: the next BOJ meeting, with a fresh Outlook Report.
Alongside these, watch oil prices and news from the Middle East, the breakeven and TIPS series on FRED, and the results of long-dated bond auctions in each market.
Common misconceptions
“Higher yields mean bonds are becoming more valuable.” The opposite is true for bonds already issued. Their prices fall. New bonds become more attractive to buy.
“Bond yields and interest rates are the same thing.” Central banks set short-term policy rates. Bond yields are set by trading and reflect expected future policy rates plus compensation for inflation and risk.
“If central banks cut, all yields must fall.” In late 2024, the Fed cut rates while long-term yields rose. Long yields can ignore short-term policy if investors expect higher inflation or demand a bigger term premium.
“Inflation is the only reason bond yields rise.” The US data this year shows real yields and policy expectations doing most of the work while breakevens stayed flat.
“Rising Treasury yields mean stocks will crash.” Stocks have risen during many periods of rising yields. The driver and the speed matter more than the direction.
“Central banks control long-term yields.” They influence them through policy rates and bond buying or selling, but long yields are set in the market.
Also Read: Key Bond Terms
Why the Current Global Bond Selloff Matters
The current episode is significant because the pressure is appearing across several major government bond markets rather than being isolated to one country.
The BIS’s September 2026 Quarterly Review describes higher yields alongside geopolitical uncertainty, inflation and monetary-policy concerns, and continuing questions about fiscal sustainability.
Vanguard similarly describes the rise in global bond yields as a combination of inflation concerns, resilient growth, more hawkish central banks and competition for capital caused by substantial sovereign and corporate issuance.
There is not complete agreement about which factor is most important.
That is normal in bond-market analysis.
Different models and institutions can attribute a move to different components because long-term yields contain several variables that cannot always be separated cleanly. The Federal Reserve itself notes that term-premium estimates depend on the model and methodology used.
The practical lesson is that investors should avoid reducing a complex global bond move to a single headline such as “inflation is rising” or “central banks are raising rates.”
Frequently Asked Questions
-
Why are bond yields rising in 2026?
Mainly because central banks switched to raising rates after an energy-driven inflation shock, economic growth held up better than expected, and governments are issuing record amounts of debt. The exact mix differs by country. -
Why do bond prices fall when yields rise?
A bond's coupon is fixed. When new bonds pay more, older bonds must fall in price until their return matches the new market yield. -
What happens when bond yields rise?
Higher yields can increase borrowing costs, reduce the market value of existing fixed-rate bonds and affect the valuation of other financial assets. At the same time, newly issued bonds can offer higher income to investors. -
How do rising bond yields affect stocks?
Higher yields can increase discount rates and borrowing costs, which can pressure equity valuations. The effect depends on why yields are rising. Strong economic growth can sometimes support corporate earnings at the same time. -
How do rising bond yields affect mortgage rates?
In the US, 30-year fixed mortgage rates tend to follow the 10-year Treasury yield plus a spread, so they have risen this year. In countries where most mortgages are variable or short-fixed, central bank rates matter more. -
Why can long-term yields rise when short-term rates are expected to fall?
Long-term yields also include inflation expectations and the term premium. If either rises, long yields can climb even while short-term rate expectations fall. -
What does a 5% 10-year Treasury yield mean?
It means the US government pays about 5% a year to borrow for 10 years. That sets a floor for many other borrowing costs, and it's the highest level since 2007. -
Can bond yields rise when central banks cut rates?
Yes. Long-term yields reflect expected future short-term rates as well as term premiums and other factors. A decline in the current policy rate does not guarantee that long-term market yields will decline. -
Are rising yields good for savers?
New savers and buyers of short-term instruments can earn more. Holders of existing long-term bonds lose value in the meantime. -
What is the difference between bond yields and interest rates?
An interest rate can refer to a policy rate set by a central bank, a loan rate charged by a lender or the coupon on a bond. A bond yield is the market return implied by a bond's price and cash flows.
Conclusion
Global bond yields are rising because investors are reassessing several parts of the economic and financial outlook at the same time.
Inflation and energy prices are affecting expectations for monetary policy. Resilient economic activity can support higher rates. Large government deficits and corporate borrowing increase the amount of debt that markets need to absorb. At the long end of the curve, investors may also demand a larger term premium for holding bonds exposed to future inflation, interest-rate and fiscal uncertainty.
The most useful way to understand rising bond yields is therefore to look beyond the headline number.
Ask which maturity is moving, whether inflation expectations are changing, what real yields are doing, how central-bank expectations are shifting, whether the term premium is increasing, and what is happening to bond supply and economic growth.
That approach provides a clearer picture of what the bond market is actually pricing.
External authority sources
BLS CPI release, 11 September 2026: US inflation figures (3.4% y/y, gasoline share).
https://www.bls.gov/news.release/cpi.nr0.htm
Federal Reserve FOMC decision, 16 September 2026: the hike to 3.75%–4.00% and the dot plot.
- CNBC: https://www.cnbc.com/2026/09/16/fed-rate-decision-september-2026.html
- J.P. Morgan: https://am.jpmorgan.com/au/en/asset-management/adv/insights/portfolio-insights/fixed-income/fixed-income-perspectives/fomc-statement-september-2026/
- Chase: https://www.chase.com/personal/investments/learning-and-insights/article/federal-reserve-raises-rates-officials-signal-one-more-hike-in-2026
- Primary source (FOMC calendar page, statement yahan se link karein): https://www.federalreserve.gov/monetarypolicy/fomccalendars.htm
Bank of England, September 2026: the vote, UK CPI and the QT changes.
- Monetary Policy Summary: https://www.bankofengland.co.uk/monetary-policy-summary-and-minutes/2026/september-2026
- Market Notice, 17 September: https://www.bankofengland.co.uk/markets/market-notices/2026/asset-purchase-facility-gilt-sales-market-notice-17-september-2026
ECB monetary policy decisions: the rate path.
- June 2026 press release (primary): https://www.ecb.europa.eu/press/pr/date/2026/html/ecb.mp260611~4d41bd5e83.en.html
- September 2026 coverage (CNBC): https://www.cnbc.com/2026/09/10/ecb-interest-rate-hike-lagarde-iran.html
NY Fed ACM term premium: the term premium estimate.
- Primary page: https://www.newyorkfed.org/research/data_indicators/term-premia-tabs
- CEIC mirror: https://www.ceicdata.com/en/united-states/treasury-term-premia/acm-10-year-treasury-term-premium
- MacroMicro mirror: https://en.macromicro.me/series/20480/us-10-treasury-term-premium
FRED series: real yields and breakevens.
- DGS10 (10-year nominal): https://fred.stlouisfed.org/series/DGS10
- DFII10 (10-year TIPS real yield): https://fred.stlouisfed.org/series/DFII10
- T10YIE (10-year breakeven): https://fred.stlouisfed.org/series/T10YIE
Yield levels and records, 24 September 2026:
- CNBC (Treasuries): https://www.cnbc.com/2026/09/24/us-treasury-yields-bonds-fed-inflation.html
- CNBC (JGBs): https://www.cnbc.com/2026/09/24/japan-jgb-bond-yield-treasurys.html
- Reuters (via US News): https://money.usnews.com/investing/news/articles/2026-09-24/u-s-30-year-bond-yield-rises-to-highest-since-2004-as-selloff-deepens
- Bloomberg (via Yahoo Finance): https://finance.yahoo.com/markets/currencies/articles/us-30-yield-hits-highest-083706130.html
Vanguard: a named institutional interpretation of the term premium and fiscal drivers.